 EndoTODAY 내시경 교실
Beginner | ESA | Schedule | OPD
Seminars | Atlas | Recent | Links
![]() [Gastric cancer 530 - 진행성 위암. 1년 전 검진내시경을 받았음]
[Gastric cancer 530 - 진행성 위암. 1년 전 검진내시경을 받았음]
001 | 101 | 201 | 301 | 401 | 501 | 601 | 701 | 801 | 901 | 1000
검진 내시경에서 위암으로 발견되어 의뢰된 분입니다. 작년 사진과 3년전 사진도 가지고 오셨습니다. 아무리 과거 사진을 잘 살펴보아도 위암 의심 부분이 없었습니다. 위암 중 어떤 것들은 빨리 자랍니다. 이 환자는 T3N3였습니다! 림프절 19개에 전이가 있었고, 과거 방식으로 D2 node인 proximal splenic까지 전이소견이 있었습니다.
고민입니다. 그렇다고 모든 환자를 매년 내시경 할 수도 없고... 검진의 length bias를 다시 한번 실감했습니다.

Stomach, subtotal gastrectomy:
Advanced gastric carcinoma
1. Location : lower third, Center at antrum and greater curvature
2. Gross type : Borrmann type 3
3. Histologic type : tubular adenocarcinoma, poorly (poorly cohesive) differentiated > moderately differentiated (30%)
4. Histologic type by Lauren : mixed
5. Size : 6.7x4.1 cm
6. Depth of invasion : penetrates subserosal connective tissue (pT3)
7. Resection margin: free from carcinoma, safety margin: proximal 2.3 cm, distal 5.6 cm
8. Lymph node metastasis : metastasis to 19 out of 34 regional lymph nodes (pN3b) (perinodal extension: present) (19/34: "3", 5/8; "4", 5/5; "5", 0/0; "6", 1/2; "7", 1/3; "9", 0/1; "8a", 0/6; "11p (proximal splenic)", 6/7; "12a", 0/0; "4sb", 0/1; "1", 0/0; perigastric, 1/1)
9. Lymphatic invasion : present
10. Venous invasion : not identified
11. Perineural invasion : present 12. AJCC stage by 7th edition: pT3 N3b
과거 여러번 소개한 바 있으니 '검진의 두 가지 중요한 비틀림 (Two important bias)'을 다시 한번 소개합니다.
건진에 조금이라도 관심이 있으면 아래 논문을 꼭 읽어보시기를 권한 바 있습니다.
Minsoo Jung. National Cancer Screening Programs and Evidence-Based Healthcare Policy in South Korea. Health Policy (2014)
건강검진에서 발견한 암은 잘 치료되는 것 같고, 오래 사는 것 같다는 느낌을 가진 분들이 많을 것입니다. 그런데 lead time bias와 length time bias라는 두개의 중요한 비틀림이 여러분의 판단을 어렵게 할 것입니다. 위 논문에 두 가지 bias에 대하여 자세한 설명이 있습니다. 하지만 제가 다시 설명해보겠습니다. 중요하니까.
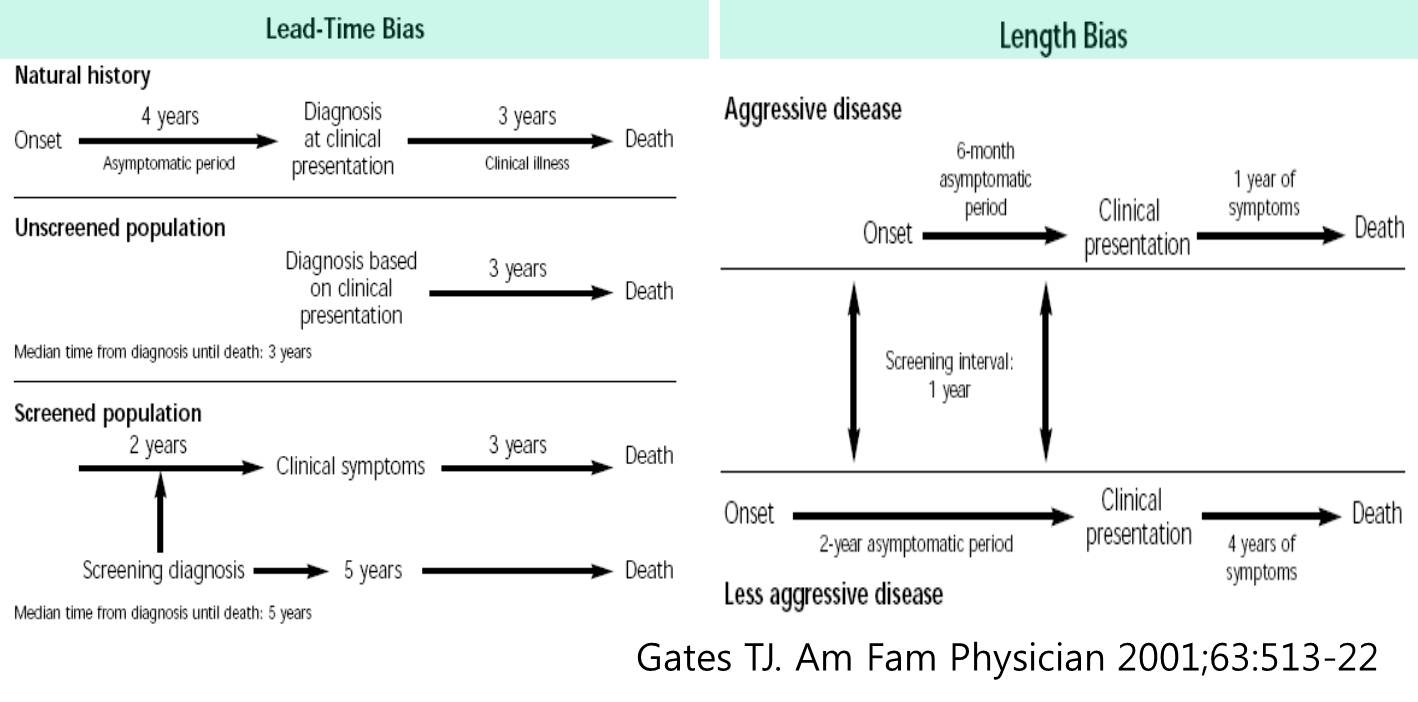
먼저 lead time bias입니다. 예를 들어 건진에서 발견된 암환자의 생존기간이 6년이고, 증상이 발생한 후 외래에서 발견된 암환자의 생존기간이 3년이라고 합시다. 3년이라는 차이가 건진의 효과인지 아니면 단지 몇 년 먼저 발견된 결과인지 구분하기 어렵습니다. 만약 3년이라는 생존기간의 차이가 단지 먼저 발견된 결과일 뿐이라면 먼저 발견할 이유가 없습니다. 병을 모르고 행복하게 살다가 어느 날 증상이 발생한 후 치료해도 결과가 마찬가지라면 먼저 발견할 이유가 없습니다. 이러한 가능성이 lead time bias입니다.
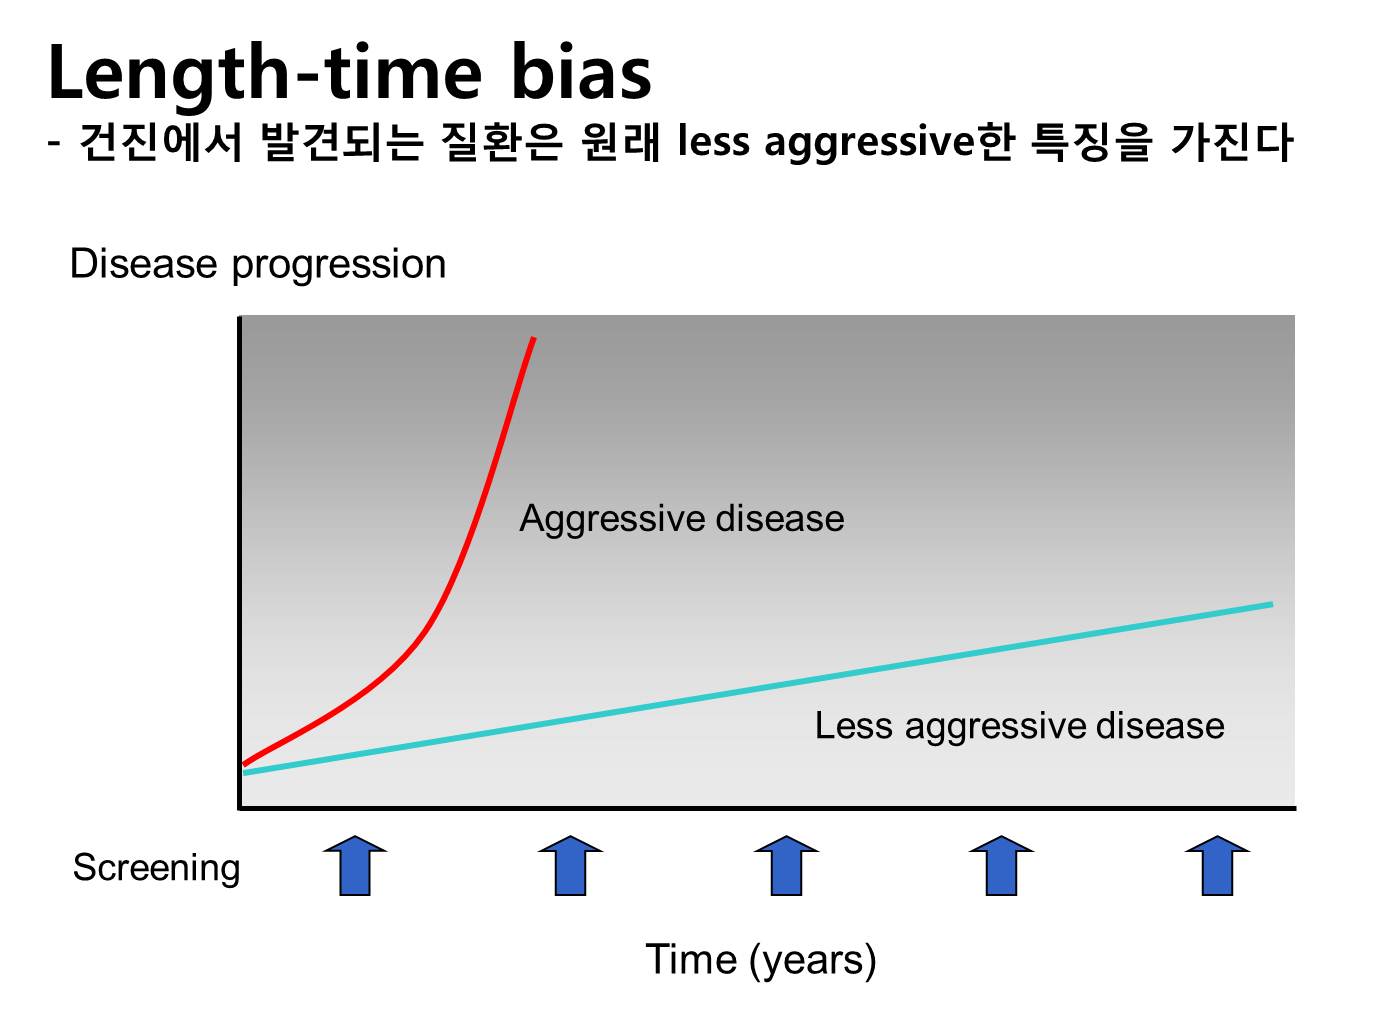
제가 더 중요하게 생각하는 것은 length time bias입니다. 어떤 암은 천천히 자라고 어떤 암은 빨리 자랍니다. 정기적인 검진을 통하여 발견되는 암은 천천히 자라는 암일 확률이 높습니다. 빨리 자라는 암은 아무 때나 증상을 일으킬 것이므로 건진에서 진단될 확률이 낮습니다. 건진에서 발견된 암의 치료성적이 좋은 것은 원래부터 천천히 자라는 암이기 때문일 수 있습니다. 애시당초 좋은 암이 건진에서 진단되기 쉽습니다. 이러한 가능성이 length time bias입니다.
Length time bias를 제 스타일로 다시 그려보면 아래 그림과 같습니다. 우리가 얻은 성적이 lead time bias나 length time bias의 결과는 아니라는 것을 과학적으로 입증할 필요가 있습니다. 좋은 것 같다는 느낌과 정말로 좋은 것은 다를 수 있기 때문입니다.
New Engl J Med에서 bias에 대하여 설명한 부분이 있어서 그림을 옮깁니다.

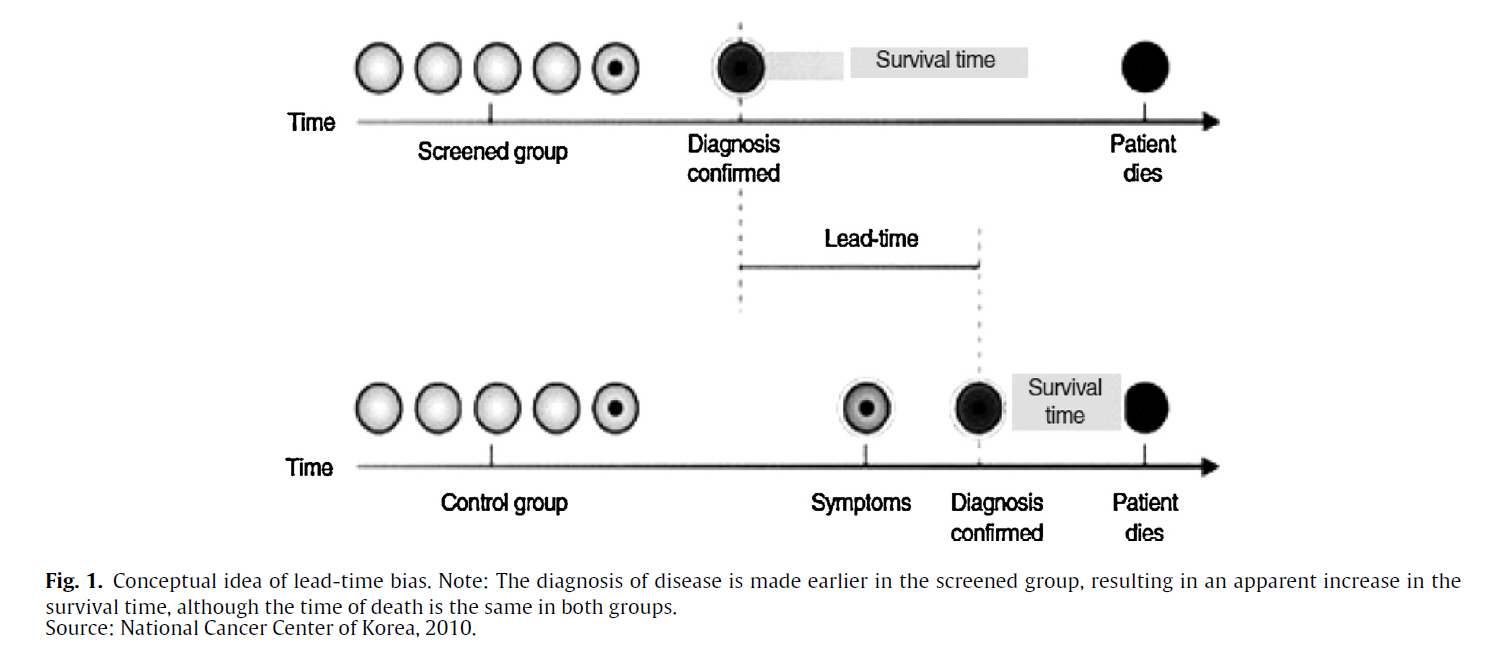
NEJM (2000) Figure 1. Lead-Time Bias. In the example shown, the diagnosis of disease is made earlier in the screened group, resulting in an apparent increase in survival time (lead-time bias), although the time of death is the same in both groups.
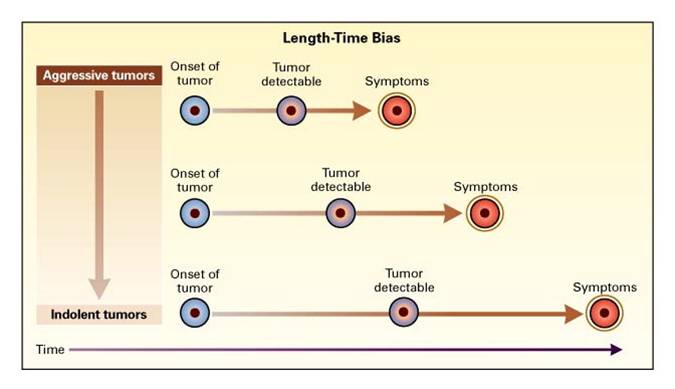
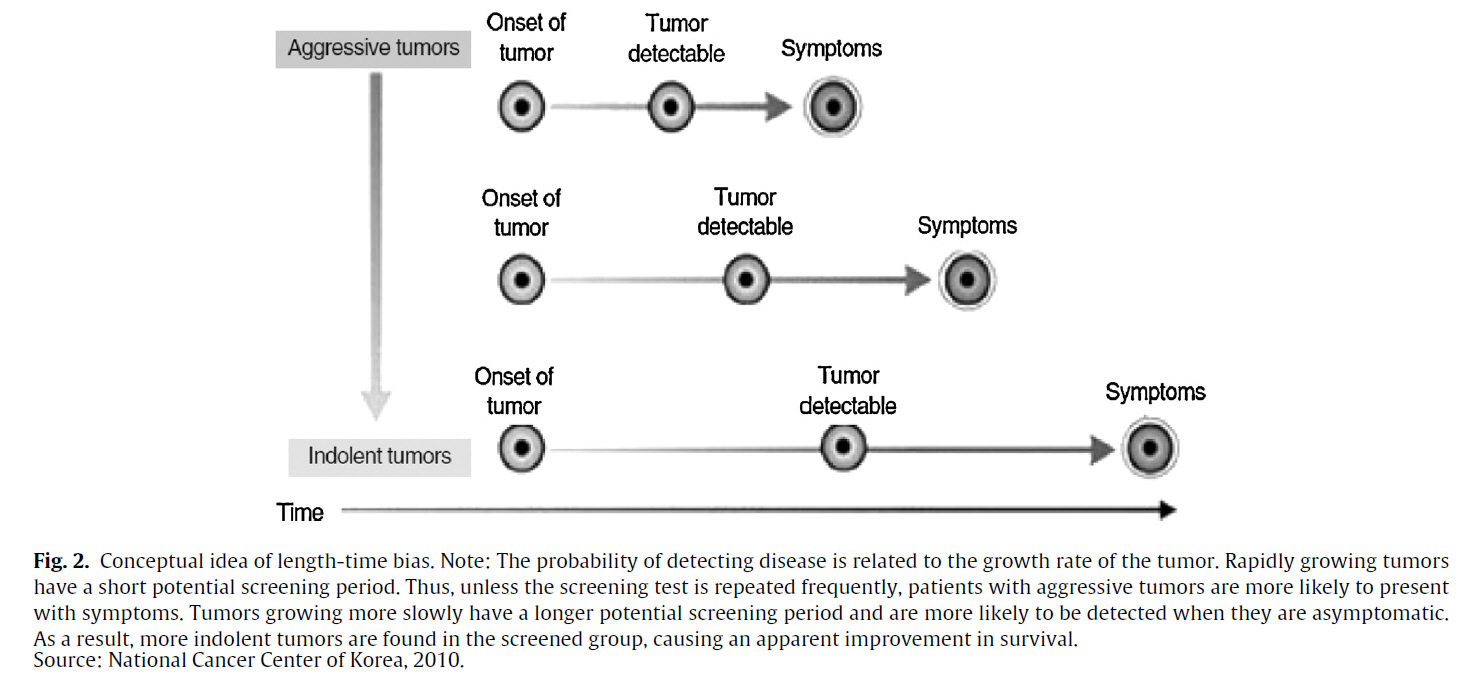
NEJM (2000) Figure 2. Length-Time Bias. The probability of detecting disease is related to the growth rate of the tumor. Aggressive, rapidly growing tumors have a short potential screening period (the interval between possible detection and the occurrence of symptoms). Thus, unless the screening test is repeated frequently, patients with aggressive tumors are more likely to present with symptoms. More slowly growing tumors have a longer potential screening period and are more likely to be detected when they are asymptomatic. As a result, a higher proportion of indolent tumors is found in the screened group, causing an apparent improvement in survival.
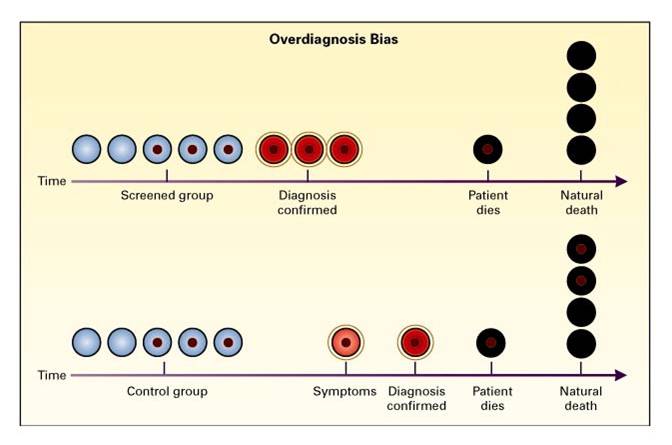
NEJM (2000) Figure 3. Overdiagnosis Bias. Overdiagnosis bias is an extreme form of length-time bias. The detection of very indolent tumors in the screened group produces apparent increases in the number of cases of lung cancer (three in the screened group in the figure and one in the control group) and in survival (two of three patients in the screened group were treated and died of natural causes, without evidence of disease [66 percent survival], and the one patient in the control group did not survive [0 percent survival]), with no effect on mortality (one death from lung cancer in each group). Two patients in the control group died with undiagnosed lung cancer that did not affect their natural life span.
![]() 2016년 1월호 Endoscopy 지에 Do's and don'ts in evaluation of endoscopic screening for gastrointestinal cancers라는 제목의 흥미로운 리뷰가 실렸습니다(Bretthauer M. Endoscopy 2016). 암검진에는 lead time bias와 length time bias가 문제라는 것은 다들 들으셨을 것입니다. 검진에서는 천천히 자라는 암이 진단되고 빨리 자라는 암은 검진으로 진단되지 않을 수 있다는 length time bias를 설명하는것은 쉬운 일이 아니었습니다. 이번 리뷰의 그림은 length time bias을 참 알기 쉽게 보여주고 있습니다. (과장하여 말하면) 꼭 필요한 병은 발견되지 않고 별로 발견하지 않아도 좋을 병만 왕창 발견되는 것이 검진일 수 있습니다. 검진 프로그램을 기획하고 검진의 효과를 홍보할 때 이 점을 간과하지 말아야 합니다.
2016년 1월호 Endoscopy 지에 Do's and don'ts in evaluation of endoscopic screening for gastrointestinal cancers라는 제목의 흥미로운 리뷰가 실렸습니다(Bretthauer M. Endoscopy 2016). 암검진에는 lead time bias와 length time bias가 문제라는 것은 다들 들으셨을 것입니다. 검진에서는 천천히 자라는 암이 진단되고 빨리 자라는 암은 검진으로 진단되지 않을 수 있다는 length time bias를 설명하는것은 쉬운 일이 아니었습니다. 이번 리뷰의 그림은 length time bias을 참 알기 쉽게 보여주고 있습니다. (과장하여 말하면) 꼭 필요한 병은 발견되지 않고 별로 발견하지 않아도 좋을 병만 왕창 발견되는 것이 검진일 수 있습니다. 검진 프로그램을 기획하고 검진의 효과를 홍보할 때 이 점을 간과하지 말아야 합니다.

Survival and lead-time bias in cancer screening. No-screening (upper time line) and screening (lower time line) in identical tumor growth scenarios are compared. In the example shown, there is no net effect of screening (time points of death are similar for screening and no-screening scenarios). The time of start of tumor growth, clinical detection, screening detection, and death are marked on the two timelines. The solid green line illustrates the time without a cancer diagnosis, the dotted green line illustrates the lead time (the individual is living with a cancer diagnosis after screening), and the dotted black line illustrates the time from the clinical diagnosis until death.

Length-time bias in cancer screening. The black arrows represent different tumor growth rates (fast, slow, very slow, nonprogressive). The red arrows represent screening events (time points at which screening is performed). Fast-growing tumors are more likely than slow-growing tumors to become symptomatic and to be diagnosed clinically before or between screening events. Thus, undersampling of fast-growing tumors (worse prognosis) compared with slow-growing tumors (better prognosis) is called the length-time bias.|
© 일원내시경교실 바른내시경연구소 이준행. EndoTODAY Endoscopy Learning Center. Lee Jun Haeng. (2017-9-25)